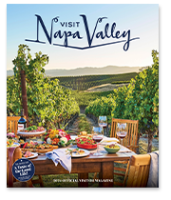
Visit Napa Valley is proud to release the findings of its “2014 Napa Valley Visitor Industry Economic Impact” report as well as its “2014 Visitor Profile” report, as a result of a yearlong visitor profile study conducted by Destination Analysts.
In 2014, the Napa Valley welcomed a total of 3.3 million visitors, which represents an increase of 12 percent from 2012 (with 2.94 million visitors), when the last Napa Valley visitor profile was conducted. In 2014, 86.4 percent of visitors were from the United States and 13.6 percent were international visitors, which represents a more than 88 percent increase in international visitors from 2012, or 211,000 additional visitors from outside the U.S. Approximately 60 percent of the increase in visitation to the Napa Valley in 2014 consists of international travelers. The tool most commonly used by visitors to plan their trip to the Napa Valley was the official Napa Valley destination website www.VisitNapaValley.com
In 2014, the Napa Valley visitor industry generated $1.63 billion in total visitor spending inside the county, most of which was generated from local hotel guests ($1.2 billion, or 72 percent of the total). Hotel guests spent an average of $389 per person, per day, with the majority of this spending attributed to wine purchases followed by restaurants. This represents a 10 percent increase from 2012, with an average daily spending of $354 per person, per day. The average visitor spent 1.9 days in the area during their trip, and visitors staying in a lodging property spent an average of 2.9 days in the Napa Valley.
“We’re very pleased with the significant increase in international visitation in 2014, which is a very positive sign of the increasingly world-class status of the Napa Valley. In addition, we’re encouraged to see, based on Smith Travel Research data over the last two years (2012 – 2014), that targeting ‘need periods’ with Visit Napa Valley’s marketing and sales efforts is working,” states Clay Gregory, president and CEO for Visit Napa Valley. “Weekday occupancy has grown one and a half times more than weekend occupancy, and group and meeting business (virtually all of which takes place on weekdays) grew two and a half times from 2012 to complement leisure travel. Additionally, ‘Cabernet Season’ (November through April) occupancy has grown nearly six times more than occupancy during peak season, which is May through October.”
The Economic Impact of Tourism
Tourism is one of the largest industries in the Napa Valley, and supports an estimated 11,776 jobs, with the majority of these jobs in either the hotel or restaurant industries
In 2014, Napa Valley’s visitor industry generated $64.2 million in tax revenues for governmental entities in Napa County. Taxes directly generated by the visitor industry include revenues from the transient occupancy tax (hotel tax), sales taxes and property and transfer taxes paid on lodging facilities.
2014 Napa Valley Visitor Profile Results
The research surveys for the 2014 Napa Valley Visitor Profile consists of three parts: a Napa Valley lodging guest survey; a Napa Valley visitor intercept survey of day-trip visitors and those staying with friends and relatives; and a telephone survey of Napa County homeowners to quantify visitors staying in private homes.
Key Findings
- The average Napa Valley visitor in 2014 was 39.4 years of age. More than 60 percent of survey respondents were 35 years of age or older, with the single largest group being millennials.
- Napa Valley visitors are an affluent group with more than half (50.5 percent) of the survey respondents reporting an annual household income of more than $100,000 or more, with an average annual income of $165,070.
- Napa Valley visitors are highly educated, with 73.2 percent having a bachelor’s degree and 28 percent who completed graduate school.
Repeat Visitation
The Napa Valley draws a substantial amount of repeat visitation, with the average visitor in 2014 making 2.3 trips to the Napa Valley in the past twelve months. Nearly 93 percent of visitors stated that they were “very likely” or “likely” to return to the Napa Valley. The top responses to the survey’s open-ended question “What would enhance the Napa Valley?” was “it’s great as it is and does not need any improvements.”
Purpose of Visit
Visitors stated the primary reason for visiting the Napa Valley was for leisure purposes (a weekend getaway or vacation), representing 73 percent of all visitors. Personal travel and wedding or special events each represented nearly 10 percent of all visitors, with nearly five percent of the visitors coming to the Napa Valley for business travel.
Napa Valley Towns Visited
While visitors to the Napa Valley tend to visit multiple towns within the area, the City of Napa received the highest number of visitors in 2014.
- City of Napa: 67 percent
- St. Helena: 59.6 percent
- Calistoga: 46.3 percent
- Yountville: 44.1 percent
- Oakville: 29 percent
- Rutherford: 26.9 percent
- Carneros area: 10.1 percent
- American Canyon: 7.6 percent
- Lake Berryessa area: 5.6 percent
- Angwin: 3.7 percent
Napa Valley Attractions and Experiences
Napa Valley’s wine (39.8 percent) and scenic beauty (37.9 percent) were what appealed most to visitors in 2014, followed by weather (11.6 percent); and food and restaurants (9.3 percent). While the Napa Valley offers many unique experiences for visitors, visiting wineries and/or tasting rooms remains the most popular visitor experience. Below is a breakdown of how Napa Valley experiences were ranked in the 2014 visitor profile study.
- Visiting wineries and/or tasting rooms: 82.3 percent
- Dining in restaurants: 69.4 percent
- Winery tours: 52.6 percent
- Shopping: 40.3 percent
- Spa treatments: 12.1 percent
- Napa Valley Wine Train: 10.3 percent
- Nightlife: 10.1 percent
- Art: 8.6 percent
- Farmer’s markets: 8.5 percent
- Guided tours: 8.3 percent
- State or local parks: 8 percent
- Culinary activities: 7.6 percent
- Hiking: 6.2 percent
- Festivals or special events: 4.7 percent
- Biking: 3.4 percent
- Hot air ballooning: 2.8 percent
- Golf: 1.7 percent
Wineries and/or Tasting Rooms
More than half of the visitors surveyed experienced three or more wineries and/or tasting rooms during their visit (56.7 percent). Nearly 70 percent of these visitors did not make advance appointments while 30.7 percent of the visitors made prior reservations. Nearly one third of these visitors (29.7 percent) joined a Wine Club during their visit and two thirds of the lodging guests surveyed (66.5 percent) purchased wine to take home. The majority of day-trip visitors (68.2 percent) reported that they were “very likely” or “likely” to purchase wine to take home.
Airports
San Francisco Airport (SFO) was the most commonly used airport by Napa Valley visitors, representing nearly 70 percent of all visitors. Oakland International Airport received 12.5 percent of visitors, followed by Sacramento International Airport (6.4 percent).


